Climate Change increasing the number of home runs in MLB.
This topic has been making the news, so it’s worth a look.
“As soon as it gets warm, the ball carries a lot better,” Washington Nationals manager Dave Martinez told The Post. “I usually tell everybody, right about the middle of May, the balls will start flying out of the ballpark.”
That’s from a team manager, so it has to be true. More home runs couldn’t possibly come from the players getting into the groove as they get a month into the season.
Simple physics explain that balls tend to fly farther on warmer days because the air is less dense. On warmer days, air molecules in outdoor stadiums are pushed farther apart from one another because they have more energy. The lower air density means the ball will encounter less air resistance than it would on a cooler day and can travel farther.
“Simple Physics”. That line is in most of the articles I’ve seen. The implication is that if you don’t agree, then you are some kind of moron. What isn’t mentioned is that fluid flow around a baseball in flight is incredibly complex. Also omitted, is how difficult it is to precisely predict the energy transfer from bat to the ball.
Those to aspects are omitted because the study the articles are based on, Global warming, home runs and the future of America’s pastime, doesn’t address those aspects.
Reading the study, the first thing to notice is that the researchers are professors of Ecology, Geography, Anthropology, Earth Science and Climate Science. There are no physicists involved.
Here we empirically estimate the relationship between gameday temperatures and home runs across >100,000 Major League Baseball games between 1962-2019 and >220,000 individual batted balls between 2015-2019. Our model is a Poisson regression, which estimates the number of home runs in a game as a function of the temperature during that game (Appendix, Eqn. 1).
This isn’t physics research, but a statistical analysis of a large number MLB games looking for a correlation.
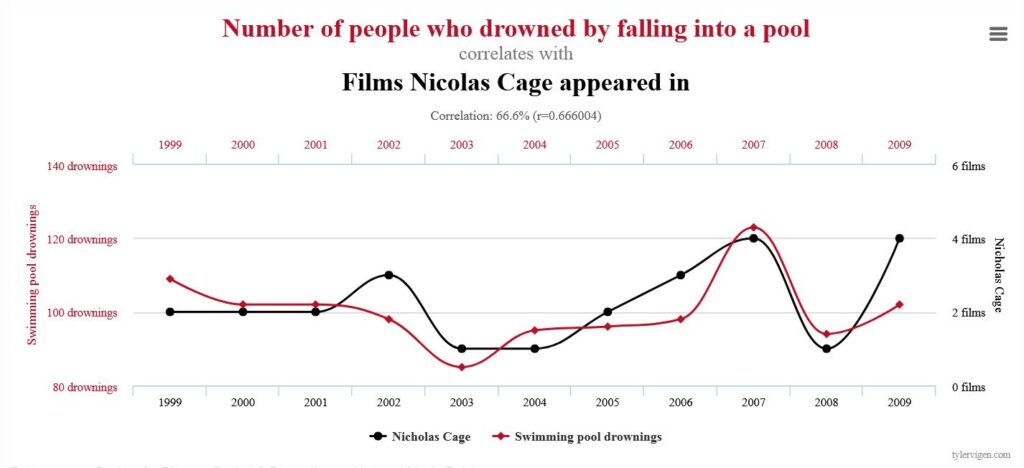
Correlation is not causation. That means just because two things trend together doesn’t mean that one causes the other. Spurious Correlations is based on that concept.
The researchers attempt to do a thorough job, but don’t consider every aspect. In some cases, the data just may not be available. They don’t take the time to consider whether their relationship is plausible.
Here is a set of graphs from the study.
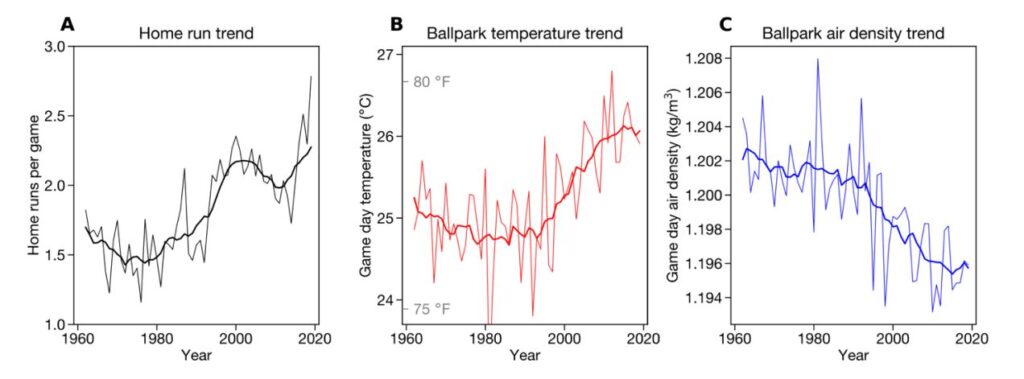
From Graph A, home runs go from a minimum of 1.45 to a maximum of 2.3. That is an increase of 58%. The air density goes from a maximum of 1.2025 to a minimum of 1.1955. That is a decrease of 0.58%.
It simply isn’t plausible that a change in air density has a 100 times larger effect on the number of home runs. There is also no explanation for the dip in home runs around 2015.
The researchers are limited by the data available.
The primary temperature data is drawn from the HadISD database v3.1.2 (Dunn, 2019; Dunn et al., 2012, 2016; Smith et al., 2011), which provides hourly data for weather stations across the United States. Using each baseball stadium’s latitude and longitude, we find the five closest HadISD stations and average them, weighting by the inverse distance between each station and the stadium.
Their temperature data sounds plausible, but whenever we look at temperature data over a long interval, urban development, sensor placement and other factors have to be considered when a difference of 1 degree is significant.
Mean temperature, vapor pressure, and sea level pressure are used to calculate air density
It isn’t clear why they use sea level air pressure to calculate air density. Many stadiums are well above sea level.
The study does list a number of other factors that may contribute to more home runs over sixty years.
- advanced analytics and data on pitcher tendencies
- training methods
- changes to the construction of baseballs
- variable dimensions of ballparks
- elevations of ballparks
These confounding variables are all swept aside.
We use fixed effects to control for the spatially varying, long-term trending, and seasonally varying factors that could confound the temperature-home run relationship (Angrist & Pischke, 2008; S. Hsiang, 2016).
That means that the researchers add factors or coefficients into their equation to match the graph. One of those coefficients represents the temperature. None of the coefficients in their equation is generated using physics equations or by testing to isolate the effect of one factor. The statistical analysis is self-verifying because the factors were chosen to match historical data. That isn’t how Physics works.
Few people will read and understand the study, and probably no one will read this post, so the researchers accomplished their goal. Using the methods of climate science, they did an analysis that superficially looks like physics.
Air temperature certainly has an effect on how far a given ball will travel. Since absolute temperature is used in the air density calculations, a 1 degree Celsius temperature increase is a change of 0.33%. To say that would result in 33% more home runs is absurd.
Getting back to “simple physics”, a simple physics test could be performed. A domed stadium has climate control. At different air temperatures, a pitching machine could be used to launch a ball at a fixed angle and speed. Using video analysis, the angle and speed could be verified. Measure the distance the ball travels.
My proposed test leaves out the geometry of ballparks and the performance of pitchers and batters, but it would yield actual, verifiable experimental results.
The only way this “Global warming, home runs and the future of America’s pastime” research can be verified is by predicting how many home runs will occur in future years. The study includes sufficient error bars so they can always declare a win. Just like climate science research.